Analysis for e-commerce shop
How to evaluate the current e-commerce performance and predict demand?
The purpose of this analysis was to evaluate the current performance of an e-commerce store, identify any trends, and forecast future sales. The data set, consisting of 523 variables from June to September, was obtained from Kaggle.
To prepare the data, I used MS Excel and Power Query to review and modify column formats and create a table. Since the data was from an open-source platform, I made no exclusions, such as missing values or confusing color labels.
Results of analysis
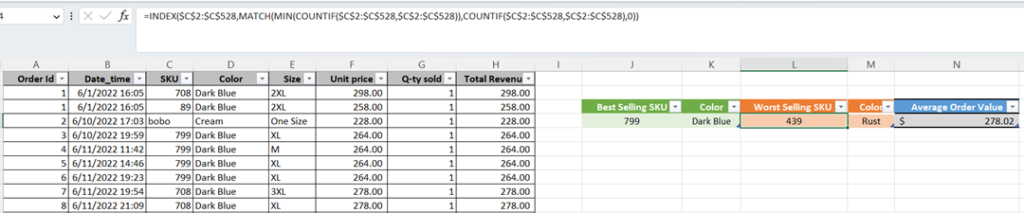
Using a combination of Pivot Tables and formulas (including INDEX, MODE, MATCH, MIN, COUNTIF, and AVERAGE), I identified the best and worst selling SKU and described them by color. The best-selling SKU was 799 in Dark Blue, while the worst-selling SKU was 439 in Rust. The analysis also revealed an average order value of $278.02.
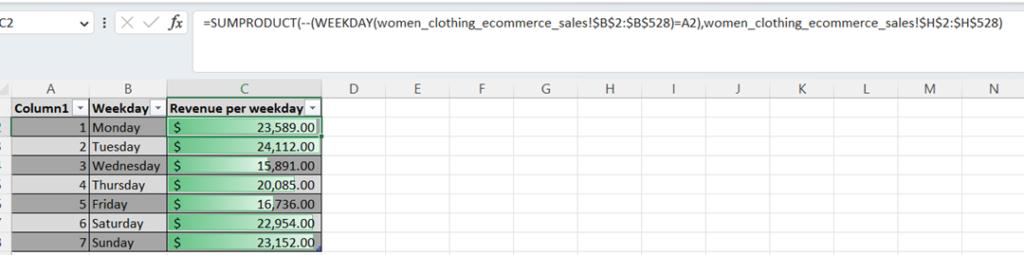
I also analyzed the sales data by determining which weekday had the highest sales from June to September. To do this, I used a combination of the SUMPRODUCT and WEEKDAY formulas, and then applied conditional formatting. I created a column (column A) that extracted the weekday from the main Date_time column to help with the analysis.
As a result, Tuesday was found to be the day with the highest sales, with a total of $24,112.00, while Wednesday had the lowest sales, with a total of $15,891.00.
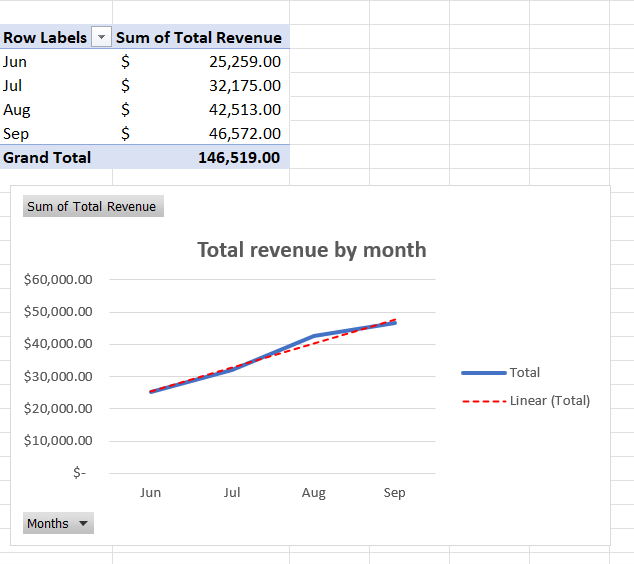
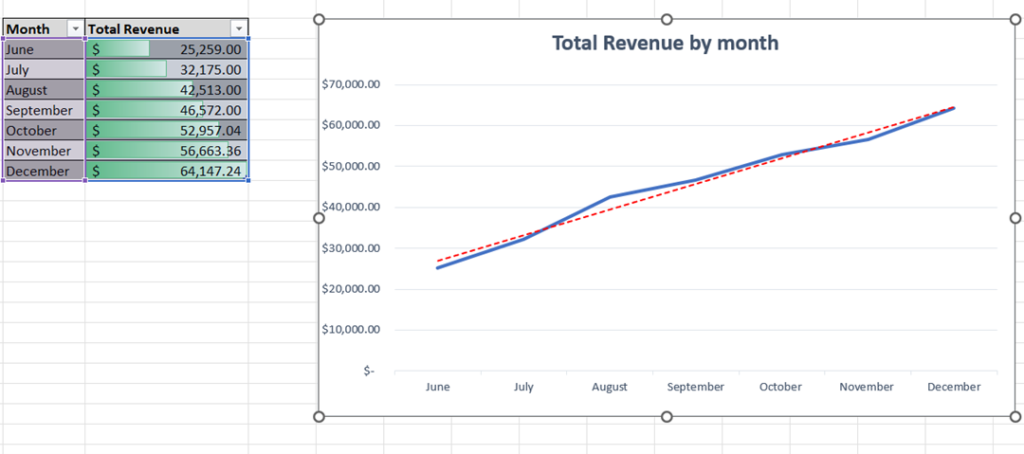
To identify trends in the data, I created a Pivot Table with the rows representing the months and the values being the sum of total sales. The data was then visualized using a line chart and trend line.
As it is clearly seen on the graph, the e-commerce store had a linear trend, with a small increase in August which can be explained by the back-to-school and work situation.
In order to make predictions, I used the TREND formula and calculated the accuracy of the prediction using the ABS formula. To double-check my prediction, I decided to start it from September 30th so that I could observe any deviation.
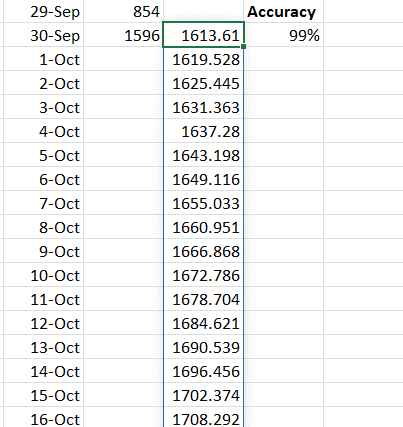
Afterwards, I visualized the actual results with the predicted ones to see if the trend had changed. As it is clearly seen on the graph, the e-commerce store still had a linear trend with a minor spike in December, which can be explained by the upcoming holidays.
Recommendations
- Stock with best-selling SKU and consider expanding the portfolio:
- Identify the complementary products that can be offered along with the best-selling SKU, based on customer preferences and buying patterns.
- Conduct market research to assess the demand for the complementary products and their potential profitability.
- Determine the optimal pricing strategy for the complementary products based on the market research and competitive analysis.
- Test the new products in the market to gauge customer response before investing heavily in inventory.
- Observe how quantity of sold SKU varies from month to month to identify pattern and set the correct MOQ:
- Analyze the historical sales data to identify the patterns in the quantity of SKU sold in different months.
- Set the minimum order quantity (MOQ) for each SKU based on the historical sales data and projected demand for each month.
- Re-evaluate the MOQ on a regular basis to ensure that it is aligned with the changing customer demand and market conditions.
- Use inventory management software to track the sales and inventory levels to ensure that the MOQ is being met and inventory is being replenished on time.